How Singapore Savings Bonds Work: A Financial Engineering Perspective
Not investment advice

Crossing the 30s mark, financial life has changed significantly, mainly due to increased liabilities. While human capital remains the primary cash-generating asset, as was common in the early 30s, it is important to build greater robustness into the system because all income depends on continuous production by the brain and body. Robustness can be achieved through downside volatility mitigation and diversification. Insurance and cash reserves can help cap the downside, and financial capital diversifies human capital risk to some extent. This article discusses building cash reserves and, in particular, the characteristics of the Singapore Savings Bonds (SSB).
Cash is “Still” the King
Many financial advisors say cash is trash because the government can “print” money and that cash will depreciate relative to other assets. Therefore, cash is a poor asset to hold. However, it is not always the case. If equity goes down by 18%, the same amount of cash can now buy 22% more equity (1/(1-18%) - 1) — cash gains in relative purchasing power even though its nominal value stays the same. In particular, during monetary tightening, bond prices fall while cash yields rise, making cash an attractive asset to hold. More generally, cash earns interest when treated as an investable asset rather than a medium of exchange, and its yield roughly follows the short end of the yield curve.
Singapore Savings Bonds
SSB is a 10-year government bond issued monthly by MAS, available to individuals in multiples of $500. What makes it unique is its structure: SSB is a single instrument with a guaranteed principal that replicates the SGS yield curve at every holding period — prioritising the step-up feature when the curve shape doesn’t naturally allow it. To my knowledge, this structure offers a few advantages:
Flexibility in holding period: Investors do not have to commit to a fixed holding period, unlike with fixed deposits and bonds. SSBs can be redeemed at par in any given month with no penalty.
No price risk: Unlike a bond, which trades on the secondary market and whose price can drop below par value, the SSB principal is guaranteed.
No reinvestment risk: The coupons are guaranteed and locked in at issuance. For 6-month or 1-year T-bills, when they mature, investors must reinvest at the then-available rate, which may be lower.
Effectively, SSB offers two embedded protections. The first is a free put option at par, allowing the investor to “sell” it back to the government at face value at any time — this protects when rates rise. The second is a free forward rate agreement on the full yield curve, locking in returns for up to 10 years — this protects when rates fall. The limitation, however, is the investment cap ($50,000 per issue and $200,000 per individual).
How SSB Rates Reflect the Yield Curve
To understand how SSB coupons are derived, it helps to look at the underlying SGS yield curve across different rate environments. The chart below shows three panels: the SGS benchmark yields (input), the resulting SSB coupon rates (output), and the average returns investors actually earn.
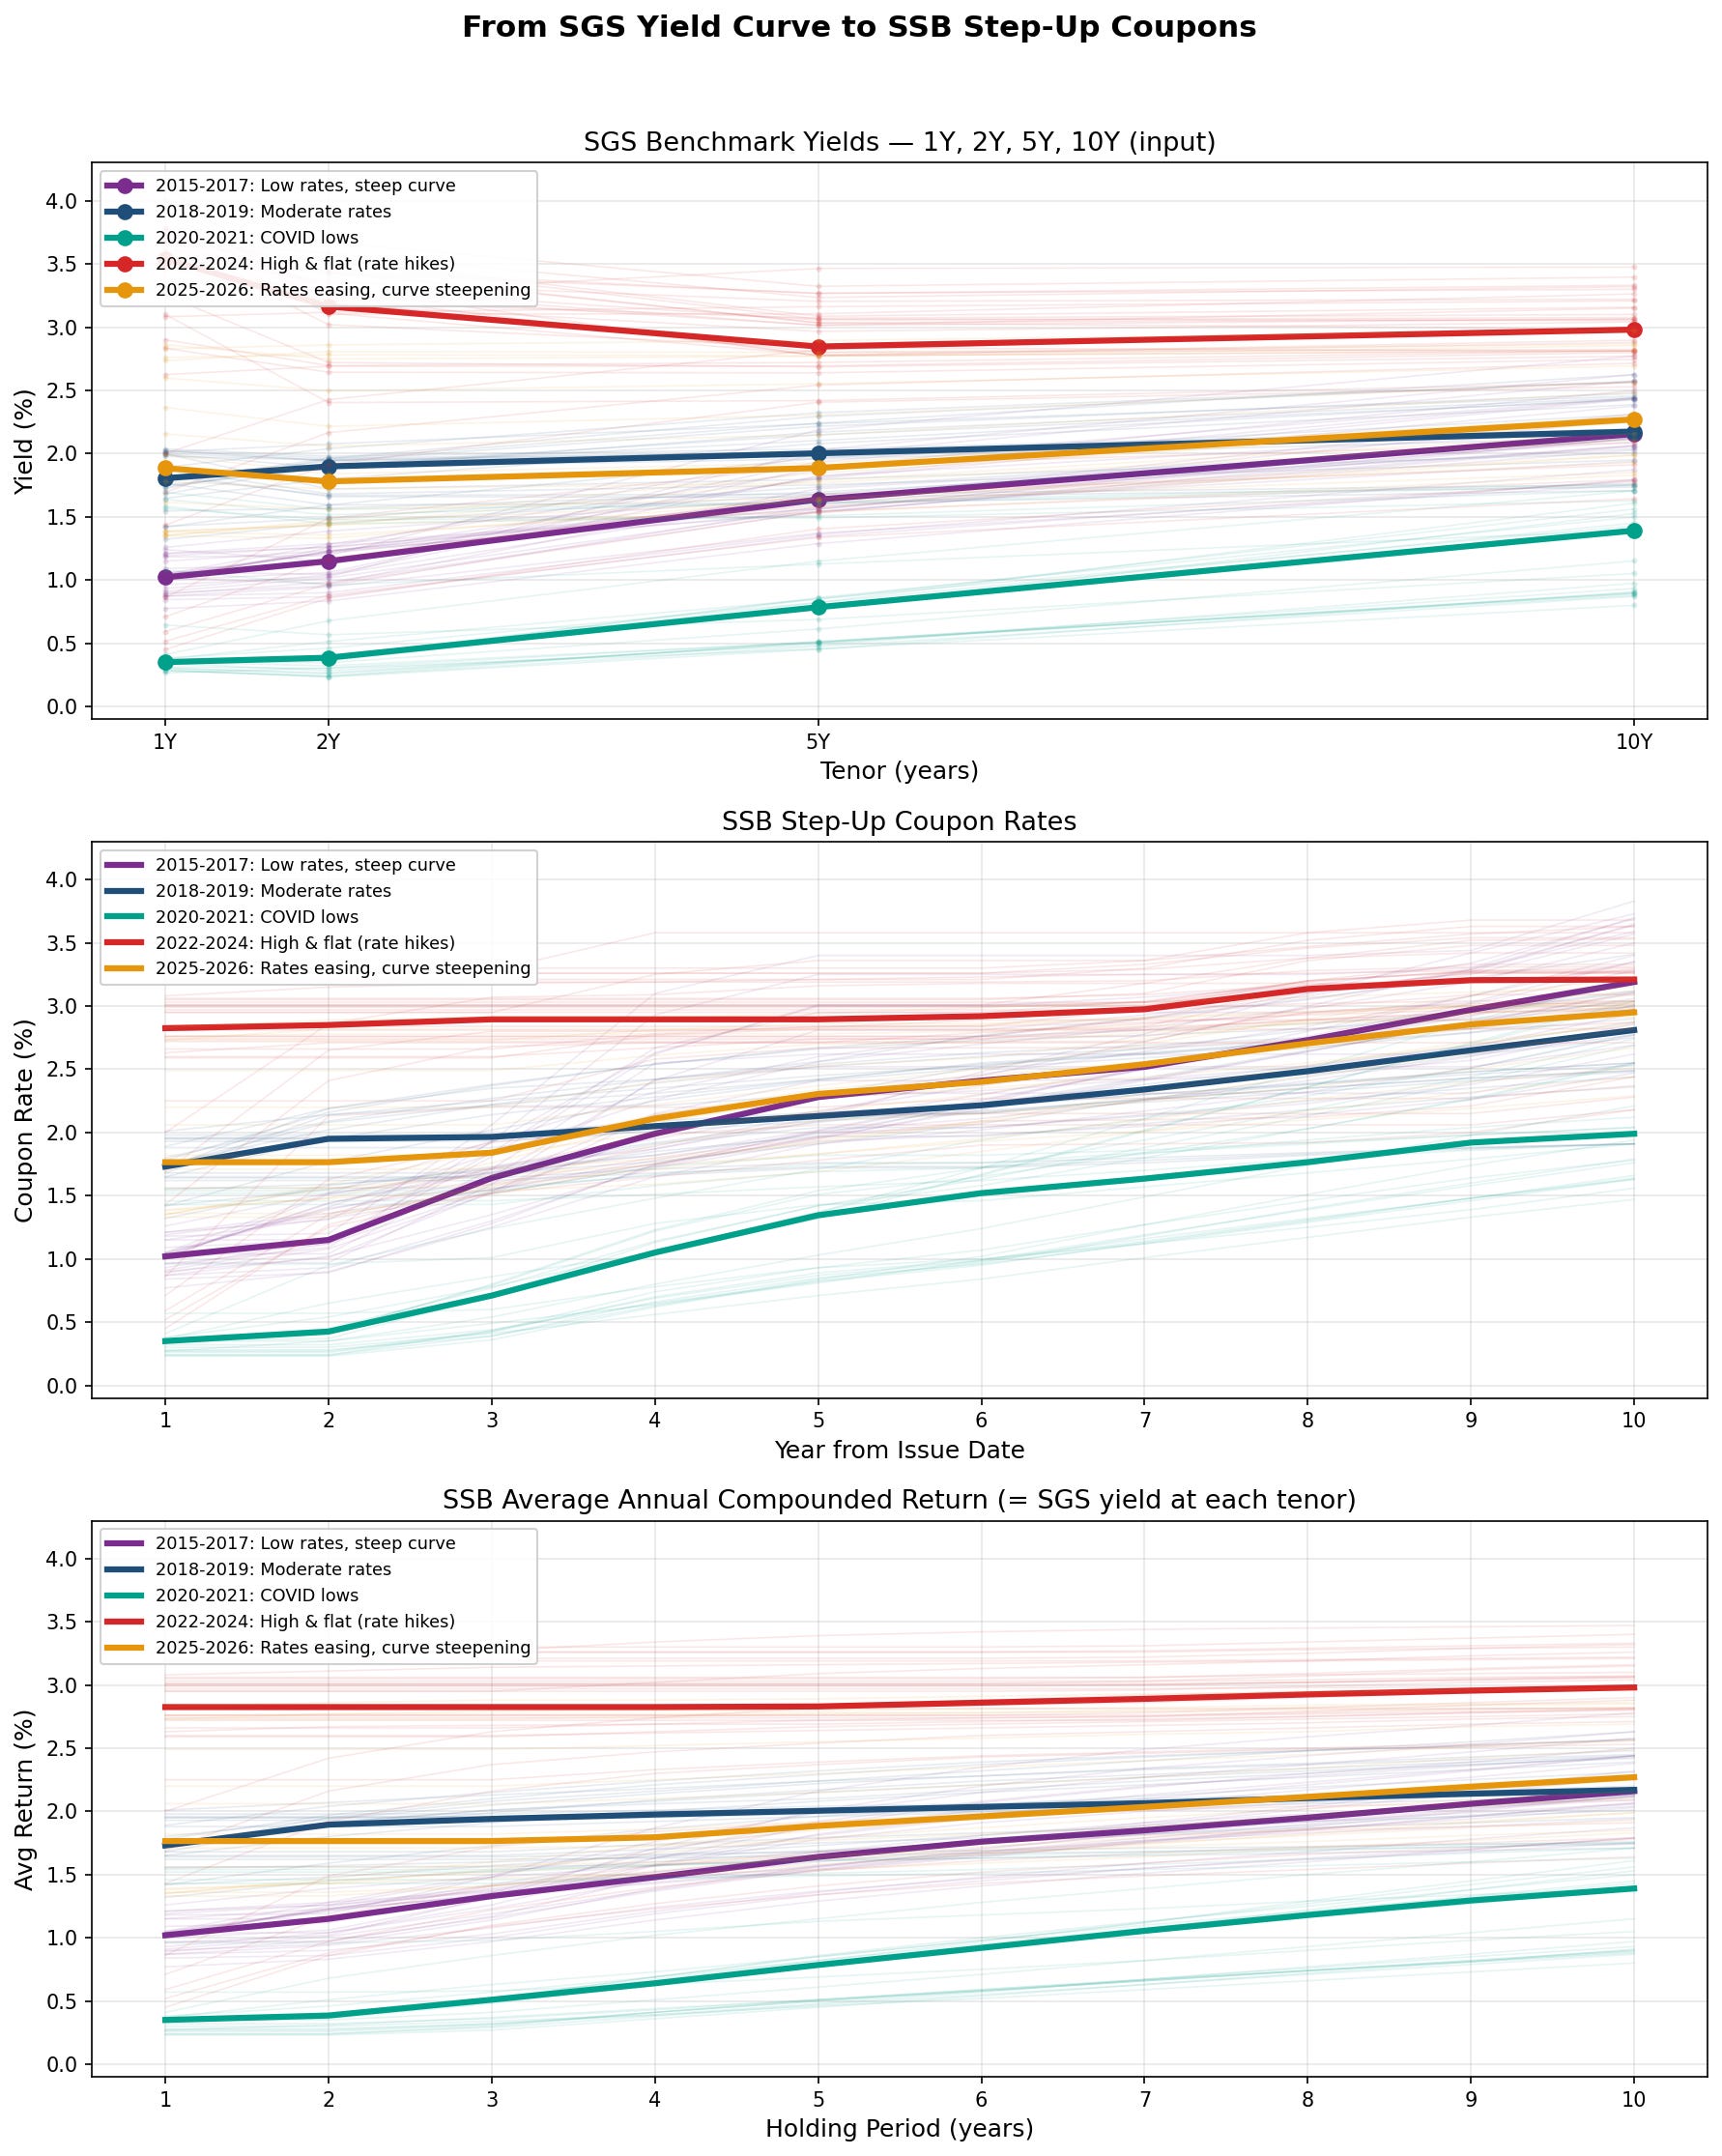
Panel 1 — SGS Yield Curves (the input)
The yield curve shape has changed dramatically across eras
2015-2017 (purple): Steep upward slope — short rates ~1%, long rates ~2.2%
2020-2021 (teal): Lowest across all tenors — near-zero short rates from COVID easing
2022-2024 (red): Inverted — short rates (~3.5%) are higher than long rates (~3%) from aggressive rate hikes
2025-2026 (orange): Re-steepening as short rates fall faster than long rates
Notably, all eras converge to a narrower range at 10Y (~1.4-3%) than at 1Y (~0.3-3.5%), reflecting the fact that long-term rate expectations are more stable than short-term policy rates.
Panel 2 — SSB Coupons (the output)
The step-up mechanism transforms the yield curve shape into a monotonically increasing schedule
Inverted curves (red) become flat coupons — the monotonicity adjustment compresses everything to the 10Y level
Steep curves (purple) produce dramatic step-ups — from ~1% to ~3.5%
The Y10 coupon is always higher than the Y10 yield because it compensates for the lower early coupons
Panel 3 — Average Returns (what investors actually earn)
This is the smoothed version of the coupon schedule — always monotonically increasing and more gradual
At 10Y, it matches the SGS yield in Panel 1 — confirming the design works
At shorter tenors, it matches SGS yields only when no monotonicity adjustment is needed
Key takeaway
The three panels tell the story of a single financial engineering pipeline: a market yield curve (which can be any shape — steep, flat, inverted) gets transformed into an investor-friendly product that always steps up, always returns principal, and always delivers the 10Y market return. The price of this guarantee is visible in the red era — when the curve inverted, short-term SSB holders earned well below the prevailing T-bill rate because the step-up constraint sacrificed short-tenor returns to preserve the monotonicity feature.
Methodology
For those interested in the methodology for deriving the SSB coupon from SGS benchmark rates, you may refer to this MAS paper. Here is a high-level skeleton:
Step 1 — Get Benchmark Yields
Download daily SGS benchmark yields from MAS Benchmark Prices and Yields
Specifically: 1-Year T-Bill Yield, 2-Year Bond Yield, 5-Year Bond Yield, 10-Year Bond Yield
Compute the simple average of all trading days from month M-2 (two months before the SSB issue month)
Step 2 — Interpolate the Full Yield Curve
Use a hermite spline to fill in the missing tenors (3Y, 4Y, 6Y, 7Y, 8Y, 9Y)
Now you have 10 par yields: Y1, Y2, ..., Y10
Step 3 — Bootstrap Discount Factors
Convert par yields into discount factors (the present value of $1 received at each future year)
DF1 = 1/(1+Y1), then each subsequent DF is solved from the no-arbitrage pricing equation
Step 4 — Solve for Step-Up Coupons
Find coupon rates C1, C2, ..., C10 such that the bond prices are at par for every holding period
This means: an investor who holds for N years and redeems at par earns the same return as an N-year SGS bond
C1 = Y1, then each subsequent coupon is solved forward using the discount factors
Step 5 — Enforce Monotonicity
If the raw coupons don’t step up (e.g. inverted yield curve), adjust them:
Minimize the pricing error across all tenors
Subject to: coupons never decrease, 10Y return is preserved exactly
Round to 2 decimal places
Data Sources
SGS benchmark yields: MAS Benchmark Prices and Yields
Published SSB rates: MAS Step-Up Interest Rates (127 bonds, Oct 2015 – Apr 2026)
Technical specification: SSB Technical Specifications, Section 4